Introduction
The Federal Housing Finance Agency’s (FHFA’s) new Uniform Appraisal Dataset (UAD) Aggregate Statistics Advanced Analytics Dashboard and the underlying data file make single-family home data easier to access and interpret. Available information includes appraisal values for purchases and refinances of single-family homes at the national, state, and county levels.
In this blog, we use a subset of the data to explore how the housing market has (and hasn’t) changed in response to the COVID-19 pandemic. Popular press and initial research suggest that the last several years have seen a change in housing location, preferences, and demand, such as a shift from cities to the suburbs and a growing preference for more space when working at home. With the UAD Aggregate Statistics Advanced Analytics Dashboard, we can examine how home appraisal values and the number of appraisals have changed over time. The underlying data give public users an opportunity to take that analysis a step further by comparing those changes across different areas of cities as well as for differently sized homes.
The general conclusion is that the recent price pressure seems consistent across urban, suburban, and rural areas. This result suggests that people may not have drastically shifted their preferences for where to live, but we see a greater rise in the valuations and counts of appraisals in rural areas than existed before the pandemic.
Location of Appraised Homes
Purchase appraisal values have generally increased over the past decade before showing explosive growth in 2020. Below, three figures demonstrate how to examine the data.1
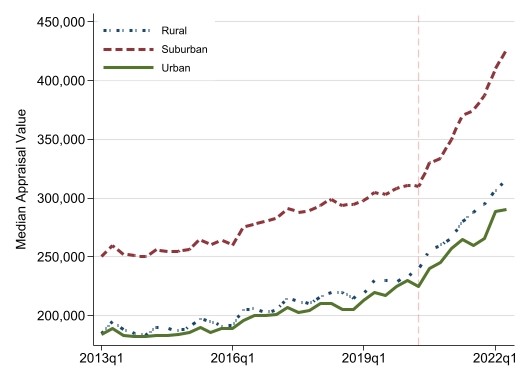
Figure 1: Median Appraisal Values by Location (in units)

Figure 1 illustrates a view similar to what a dashboard user would see if graphing one series at a time, though we show three series together for ease of comparison. The takeaway is that purchase loan appraisal values are much higher in the suburbs than elsewhere, but all areas follow similar trends. However, only looking at the levels of appraisal values makes it difficult to compare relative or cumulative changes in appraisals for the three types of areas. Therefore, Figures 2 and 3 show normalized appraisal values and appraisal counts for the same areas and time periods.
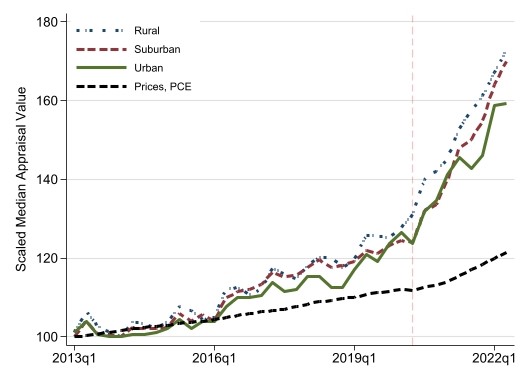
Figure 2: Re-scaled Median Appraisal Values (as indices)

Figure 2 rescales appraised values to have a common starting point in 2013. It reveals the changes have been remarkably similar between urban, suburban, and rural areas. The rescaling starts each type of area with the same value of 100 and allows users to see how median appraisal values have changed since a decade ago when housing prices began to consistently rise again. In other words, it does not matter that suburban homes always have a higher median appraisal value than rural areas (i.e., in Figure 1, the dashed red line for suburban areas is always above the dot-dash blue line for rural areas) because we want to compare the relative changes to determine if one location has appreciated faster than another. Rural areas seem to have a slightly larger gain, but the divergence starting before the vertical-dashed red line suggests that pattern emerged even before the COVID-19 pandemic. Moreover, single-family appraisal values have outpaced inflation increases since about 2016 (as tracked by personal consumption expenditures (PCE)) and by an even wider margin since the pandemic began but without preference for urban, suburban, or rural area location.
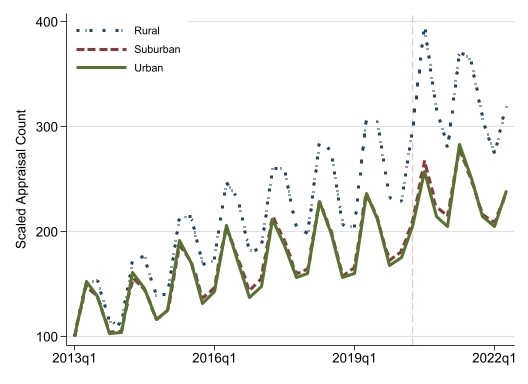
Figure 3: Re-scaled Appraisal Counts by Location

Figure 3 changes the approach slightly by asking not whether relative values have increased, but if the number of appraisals has risen differently based on location. The data demonstrate that rural area counts have increased more than in suburban and urban areas. Again though, the split existed prior to the pandemic.
Summary
In conclusion, the UAD Aggregate Statistics Advanced Analytics Dashboard and data suggest that during the last two years, home appraisal values have increased significantly. The tendency for appraisal values to outpace the rate of inflation, as measured by PCE, was present well before the pandemic began. Please note these caveats to the statistics we discussed:
- We only looked at summary statistics without controlling for applicant characteristics.
- Appraisal values differ from contract purchase prices, but they show similar overall trends across rural, suburban, and urban areas.
- The UAD Aggregate Statistics Advanced Analytics Dashboard only includes conventional and conforming loans provided as potential financing for single-family homes. Some property appraisals may not end up being used for a mortgage loan. Gaps also occur for other lending market segments as well as purchases made without mortgage financing.
- Urban areas with a large share of condos are not fully represented.
These caveats aside, the UAD Aggregate Statistics Advanced Analytics Dashboard provides an exciting new opportunity to study the value and characteristics of homes being appraised across the country.
In our next blog, we look at what the dashboard reveals about changes in home size during the pandemic.
If you have any questions or comments about the FHFA UAD Aggregate Statistics Data File or Dashboards, please email Statistical_Products@fhfa.gov.
1 All three figures are based on the authors’ calculations using UAD dashboard data from the second quarter of 2022. We compute each series using “quarterly” frequency and “national” geographic level while filtering for “purchase” mortgage loan type. PCE Price Index (denoted as “Prices, PCE”) is from the Bureau of Economic Analysis. A vertical dashed red line denotes the start of the COVID-19 pandemic.
Source: Federal Housing Finance Agency


